
 Benchmarking spatial and single-cell transcriptomics integration methods for transcript distribution prediction and cell type deconvolution
题目: 用于转录分布预测和细胞类型反卷积的空间和单细胞转录组学整合方法的基准测试
DOI: https://doi.org/10.1038/s41592-022-01480-9 (opens new window)
Cite: Li, B., Zhang, W., Guo, C. et al. Benchmarking spatial and single-cell transcriptomics integration methods for transcript distribution prediction and cell type deconvolution. Nat Methods 19, 662–670 (2022).
作者介绍:
| Kun Qu |
|---|
 |
| 中国科学技术大学 |
| qukun@ustc.edu.cn |
# Abstract:
空间转录组学方法极大地提高了我们检测组织中RNA转录本空间分布的能力,但表征空间中单细胞的全转录组水平数据仍然具有挑战性。 为了满足这一需求,研究人员开发了整合方法,将空间转录组数据与单细胞 RNA-seq 数据相结合,以预测未检测到的转录本的空间分布和/或对组织学切片中的 spot 进行细胞类型反卷积。 然而,迄今为止,还没有独立研究对这些集成方法进行比较分析以对其性能进行基准测试。 在这里,我们使用 45 个配对数据集(包括空间转录组学和 scRNA-seq 数据)和 32 个模拟数据集对 16 种集成方法进行基准测试。 我们发现Tangram、gimVI、SpaGE在预测RNA转录本空间分布方面优于其他集成方法,而Cell2location、SpatialDWLS、RCTD是spot细胞类型反卷积的最佳方法。 我们提供基准管道来帮助研究人员选择最佳的集成方法来处理他们的数据集。
# Results:
# Figure 1: Benchmarking workflow and summary characteristics of the examined paired datasets.
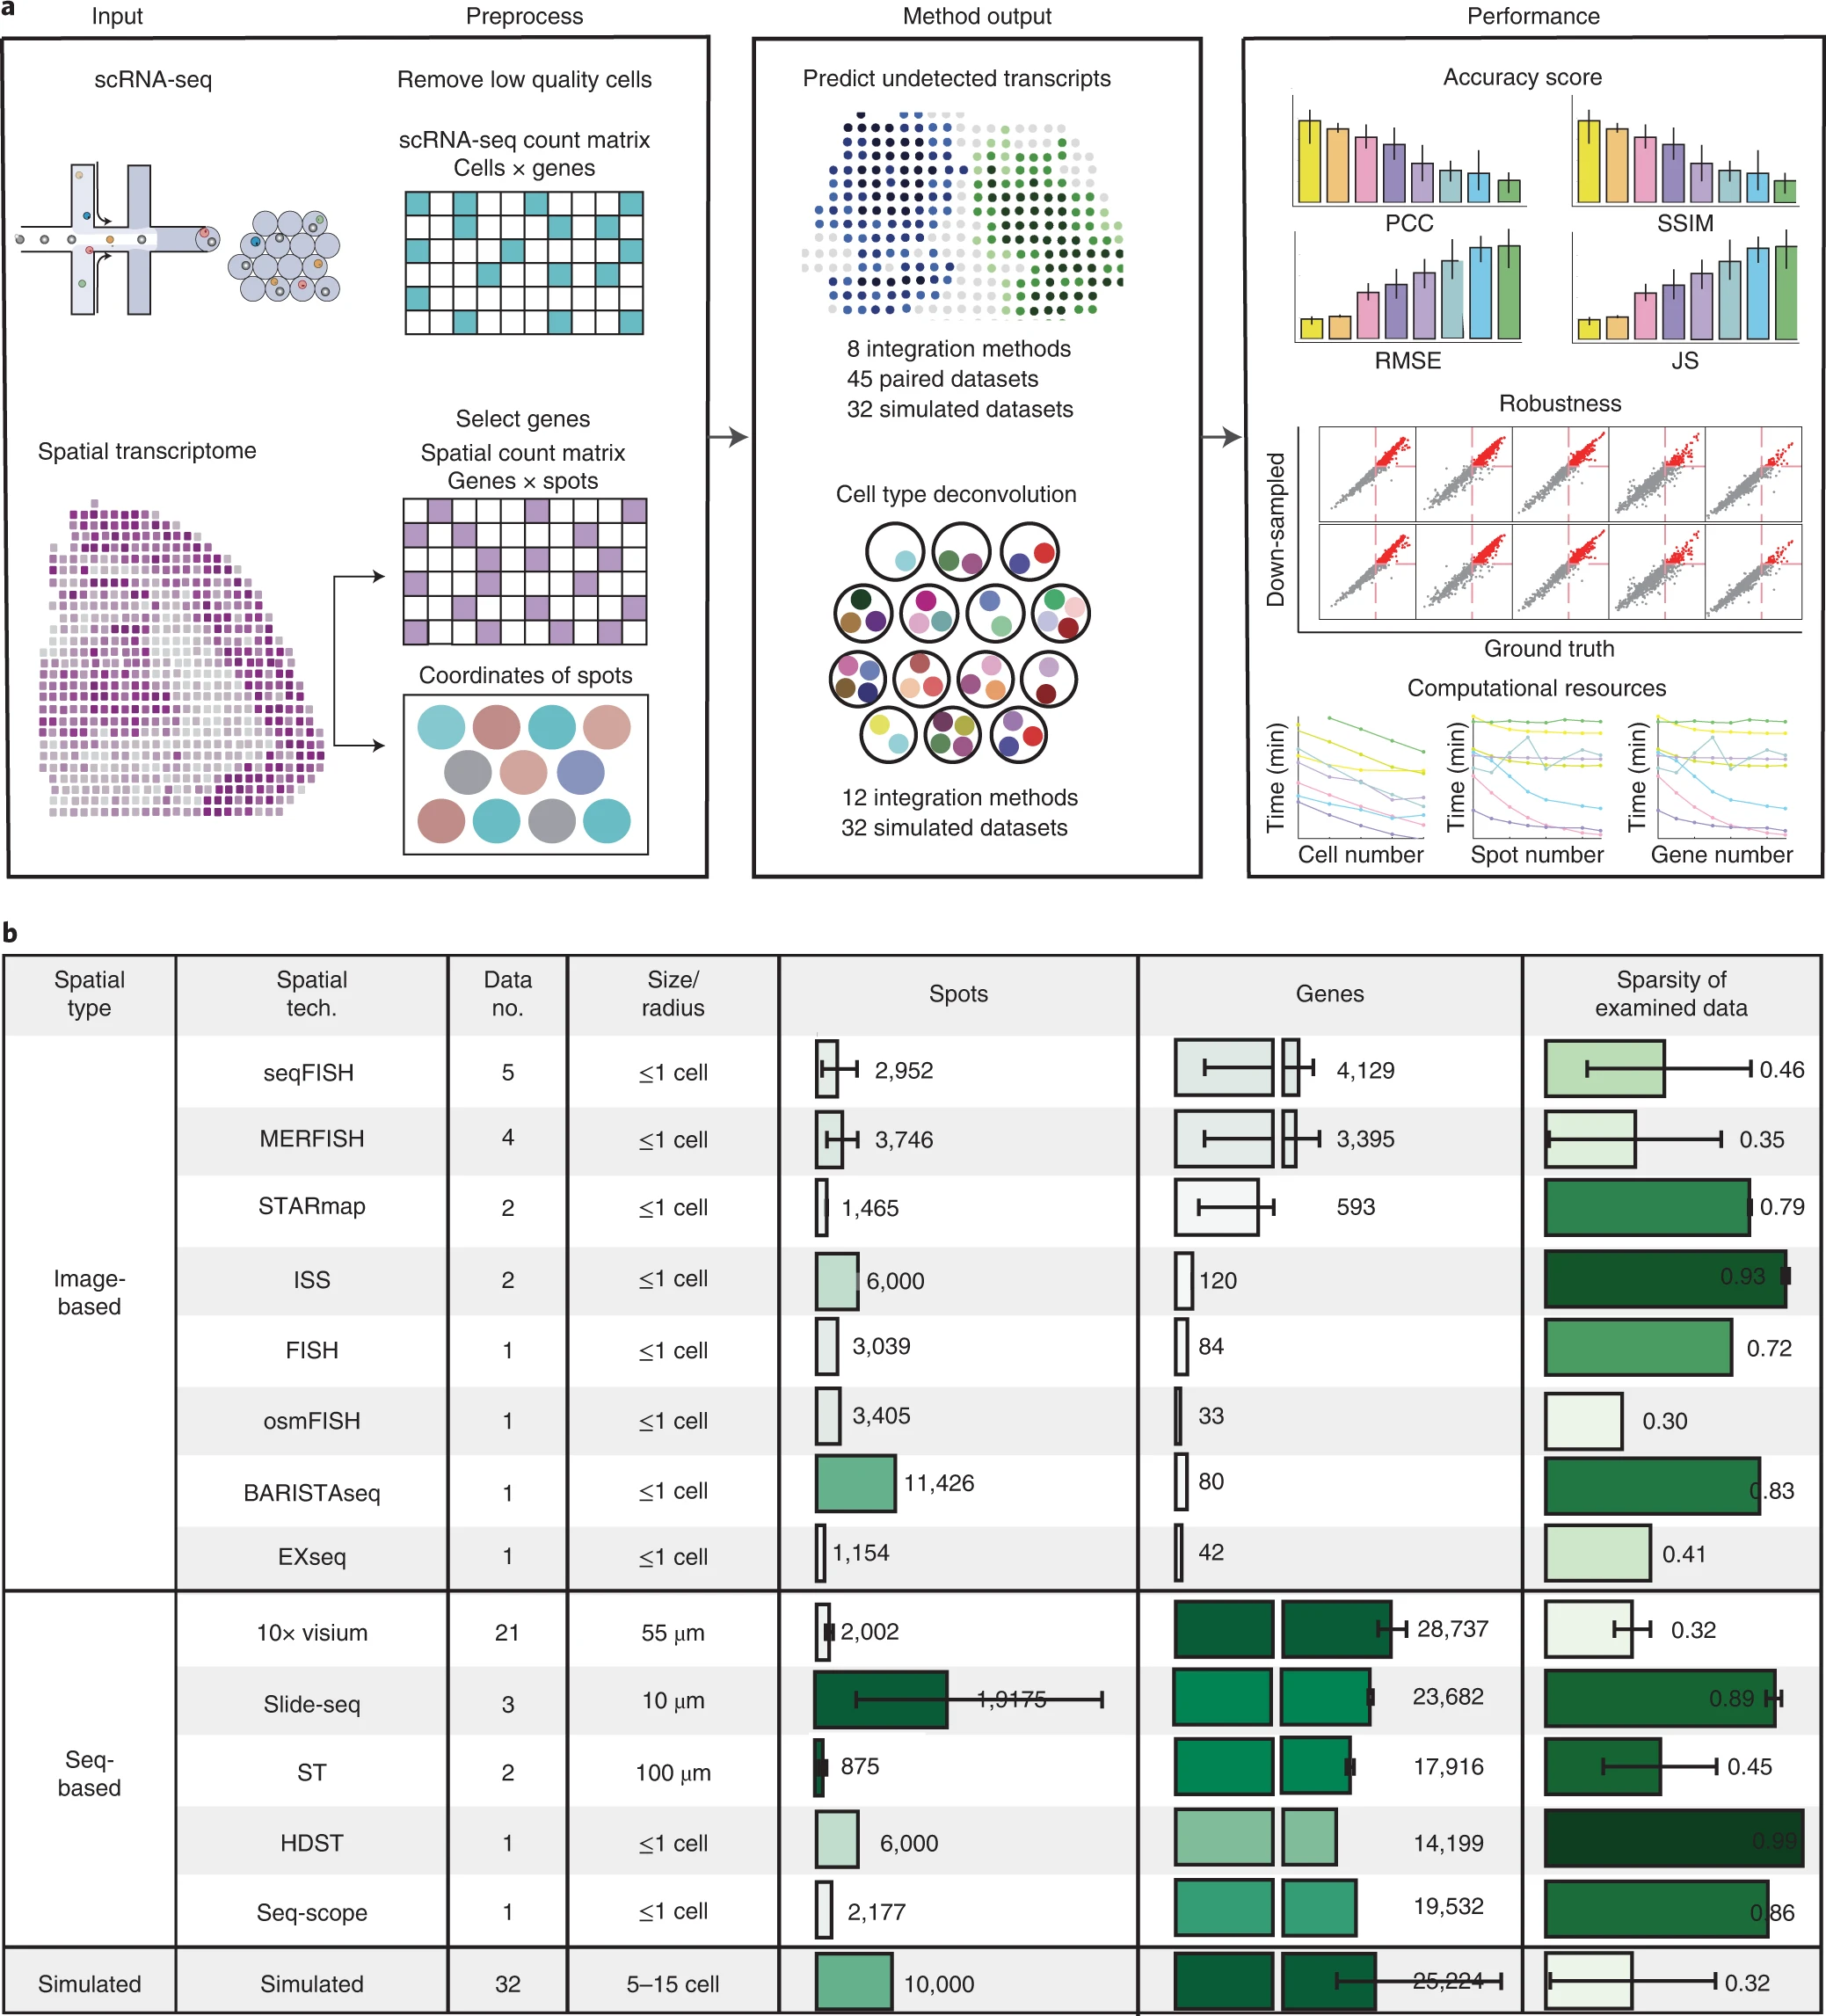
Figure 1. 基准测试工作流程和所检查的配对数据集的摘要特征
(a) 用于比较配对空间转录组学和 scRNA-seq 数据集的集成方法性能的基准测试工作流程的示意图。我们使用 16 种整合方法来组合空间和单细胞转录组数据,然后比较它们在 (1) 预测 RNA 转录本的空间分布和 (2) 组织学 spot 的细胞类型去卷积方面的性能。我们还评估了集成方法消耗的计算资源。
(b) 本研究中使用的 45 个配对数据集和 32 个模拟数据集的信息:每个数据集包含同一组织的空间转录组数据和 scRNA-seq 数据。
# Figure 2: Comparing the accuracy of eight integration methods capable of predicting the spatial distribution of RNA transcripts.
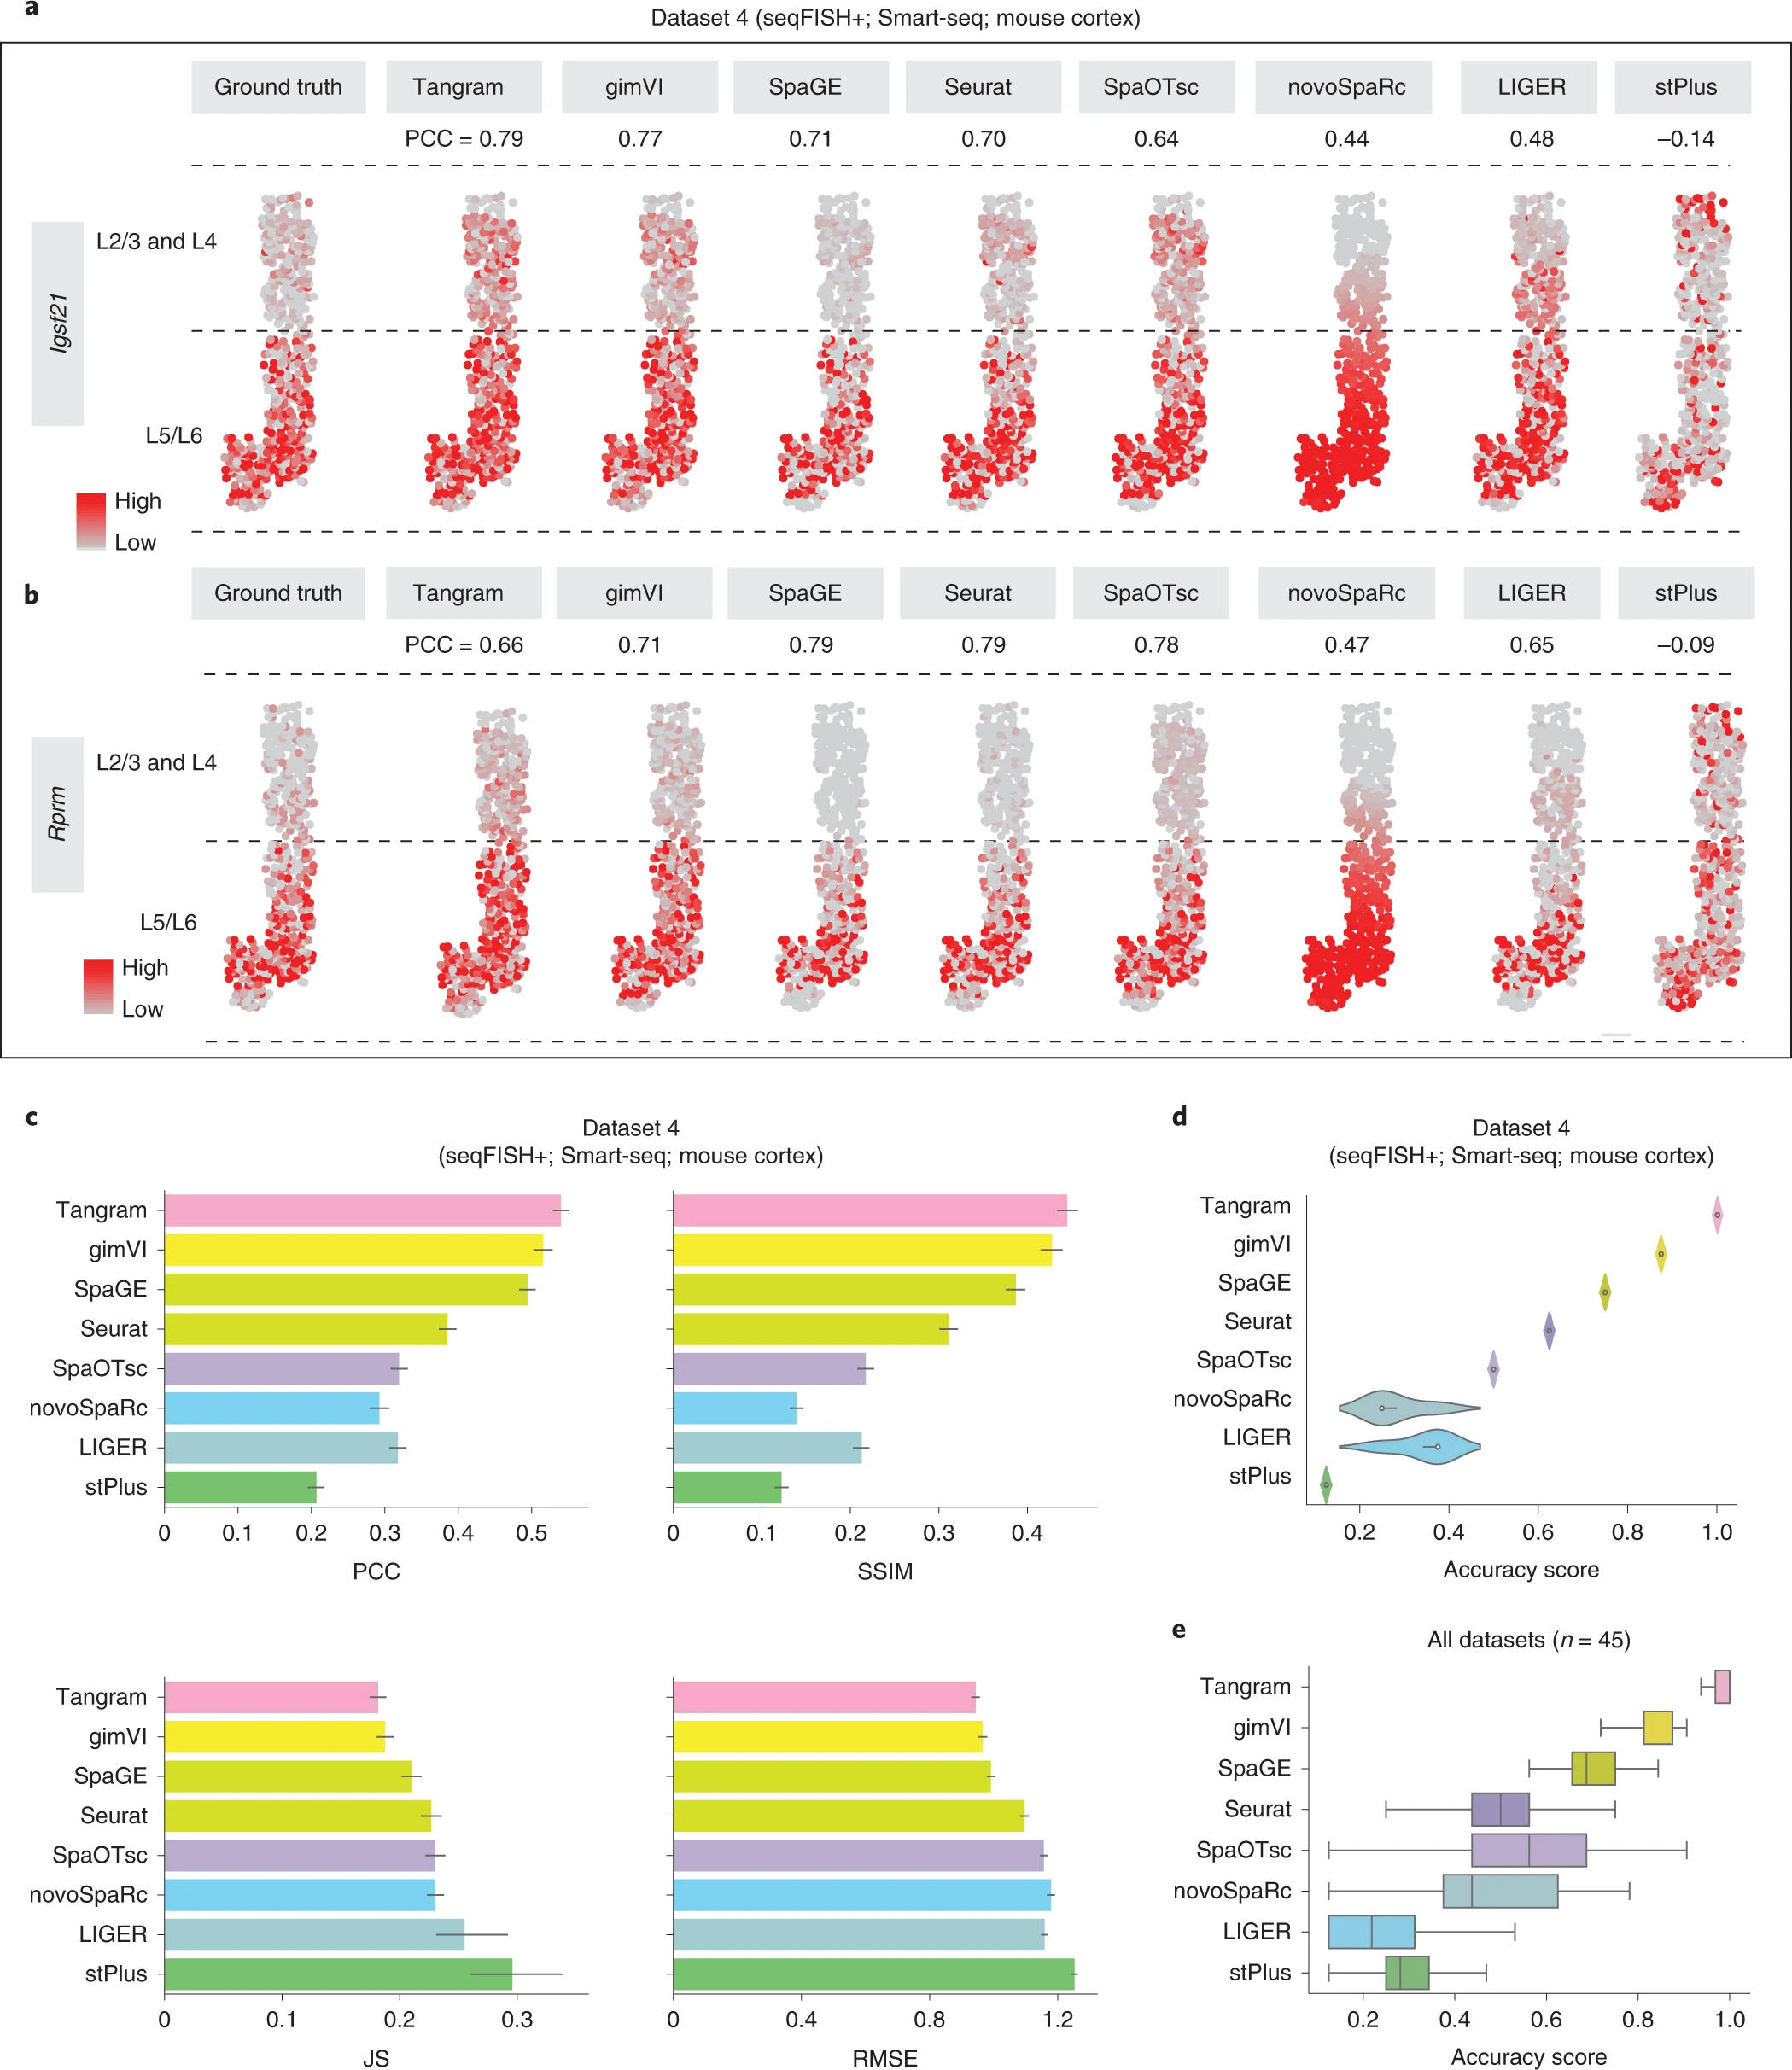
Figure 2. 比较八种能够预测 RNA 转录本空间分布的整合方法的准确性
(a,b) 数据集 4(seqFISH+;Smart-seq;小鼠皮质)中Igsf21 ( a ) 和Rprm ( b )的空间分布,包括真实值和每种集成方法的预测结果。PCC,真实转录本的表达向量与预测结果的表达向量之间的皮尔逊相关系数。
(c) 每种集成方法预测数据集4中转录本空间分布的PCC、SSIM、RMSE和JS条形图。数据以平均值±95%置信区间表示。
(d) 数据集 4 中转录本的 8 种整合方法的 AS 小提琴图(从 PCC、SSIM、RMSE 和 JS 值聚合;参见方法);n = 4 个基准指标。
(e) 所有 45 个配对数据集的 8 种整合方法的 AS 箱线图。n = 45 个独立数据集。
# Figure 3: Comparing the accuracy of the eight integration methods for sparse spatial expression matrices down-sampled from the original datasets using Splatter.
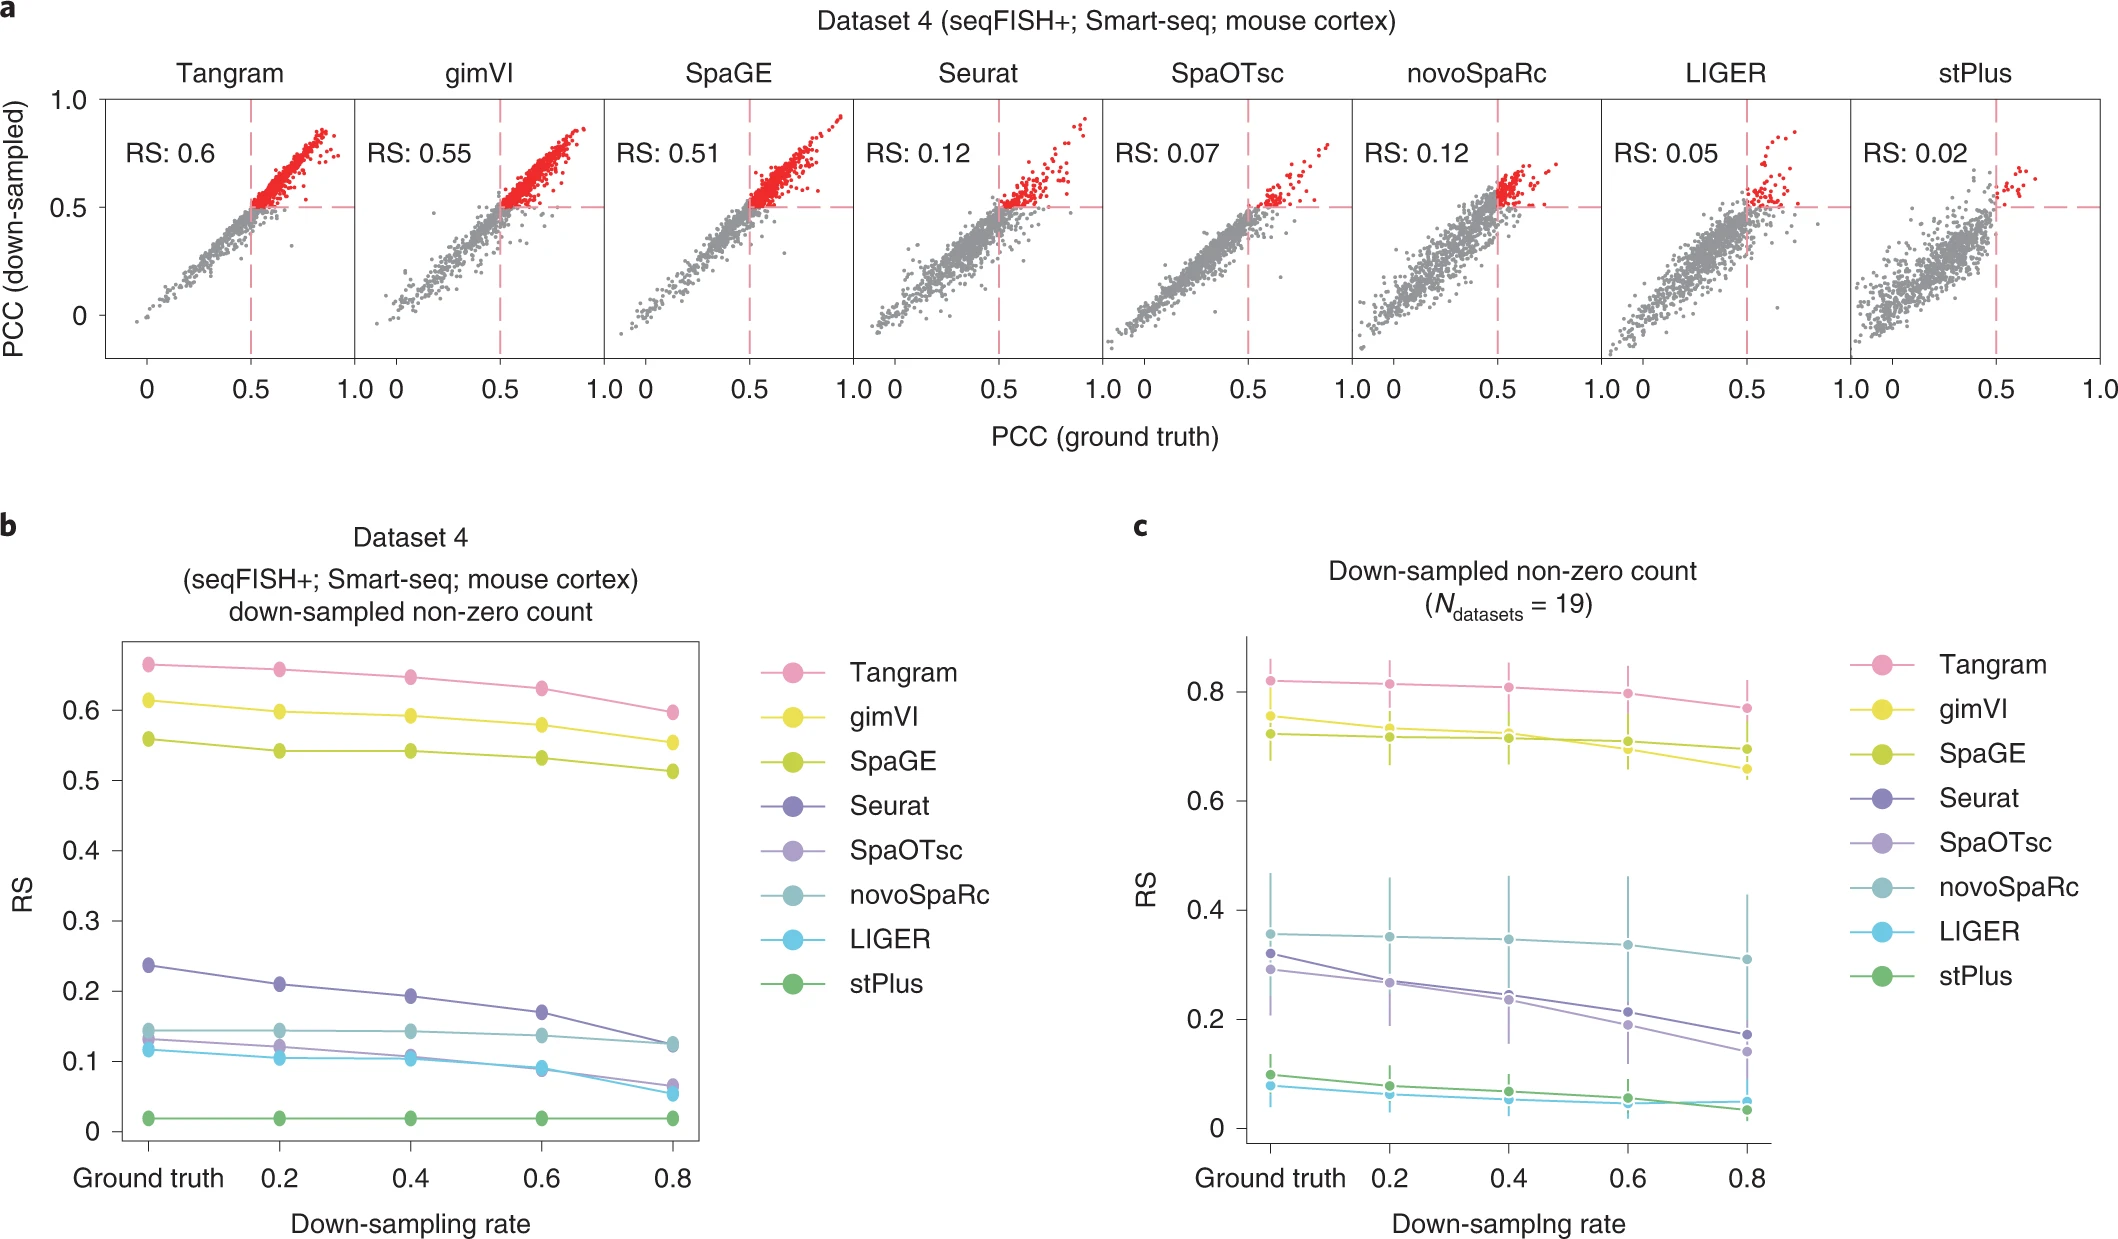
Figure 3. 比较使用 Splatter 从原始数据集下采样的稀疏空间表达矩阵的八种整合方法的准确性
(a) 根据原始数据和数据集 4 的下采样数据预测的转录本的空间分布的 PCC。对于原始数据和下采样数据,红色转录本的 PCC 值都大于 0.5。红色转录本在所有转录本中的比例定义为RS。
(b) 8种整合方法以不同下采样率进行下采样在处理数据集 4 的稀疏表达矩阵时的RS值。
(c) 处理下采样数据集的稀疏表达矩阵时八种整合方法的RS值。n = 19 个独立数据集。
# Figure 4: Comparing the performance of the 12 integration methods capable of deconvoluting cell types of each histological spot.
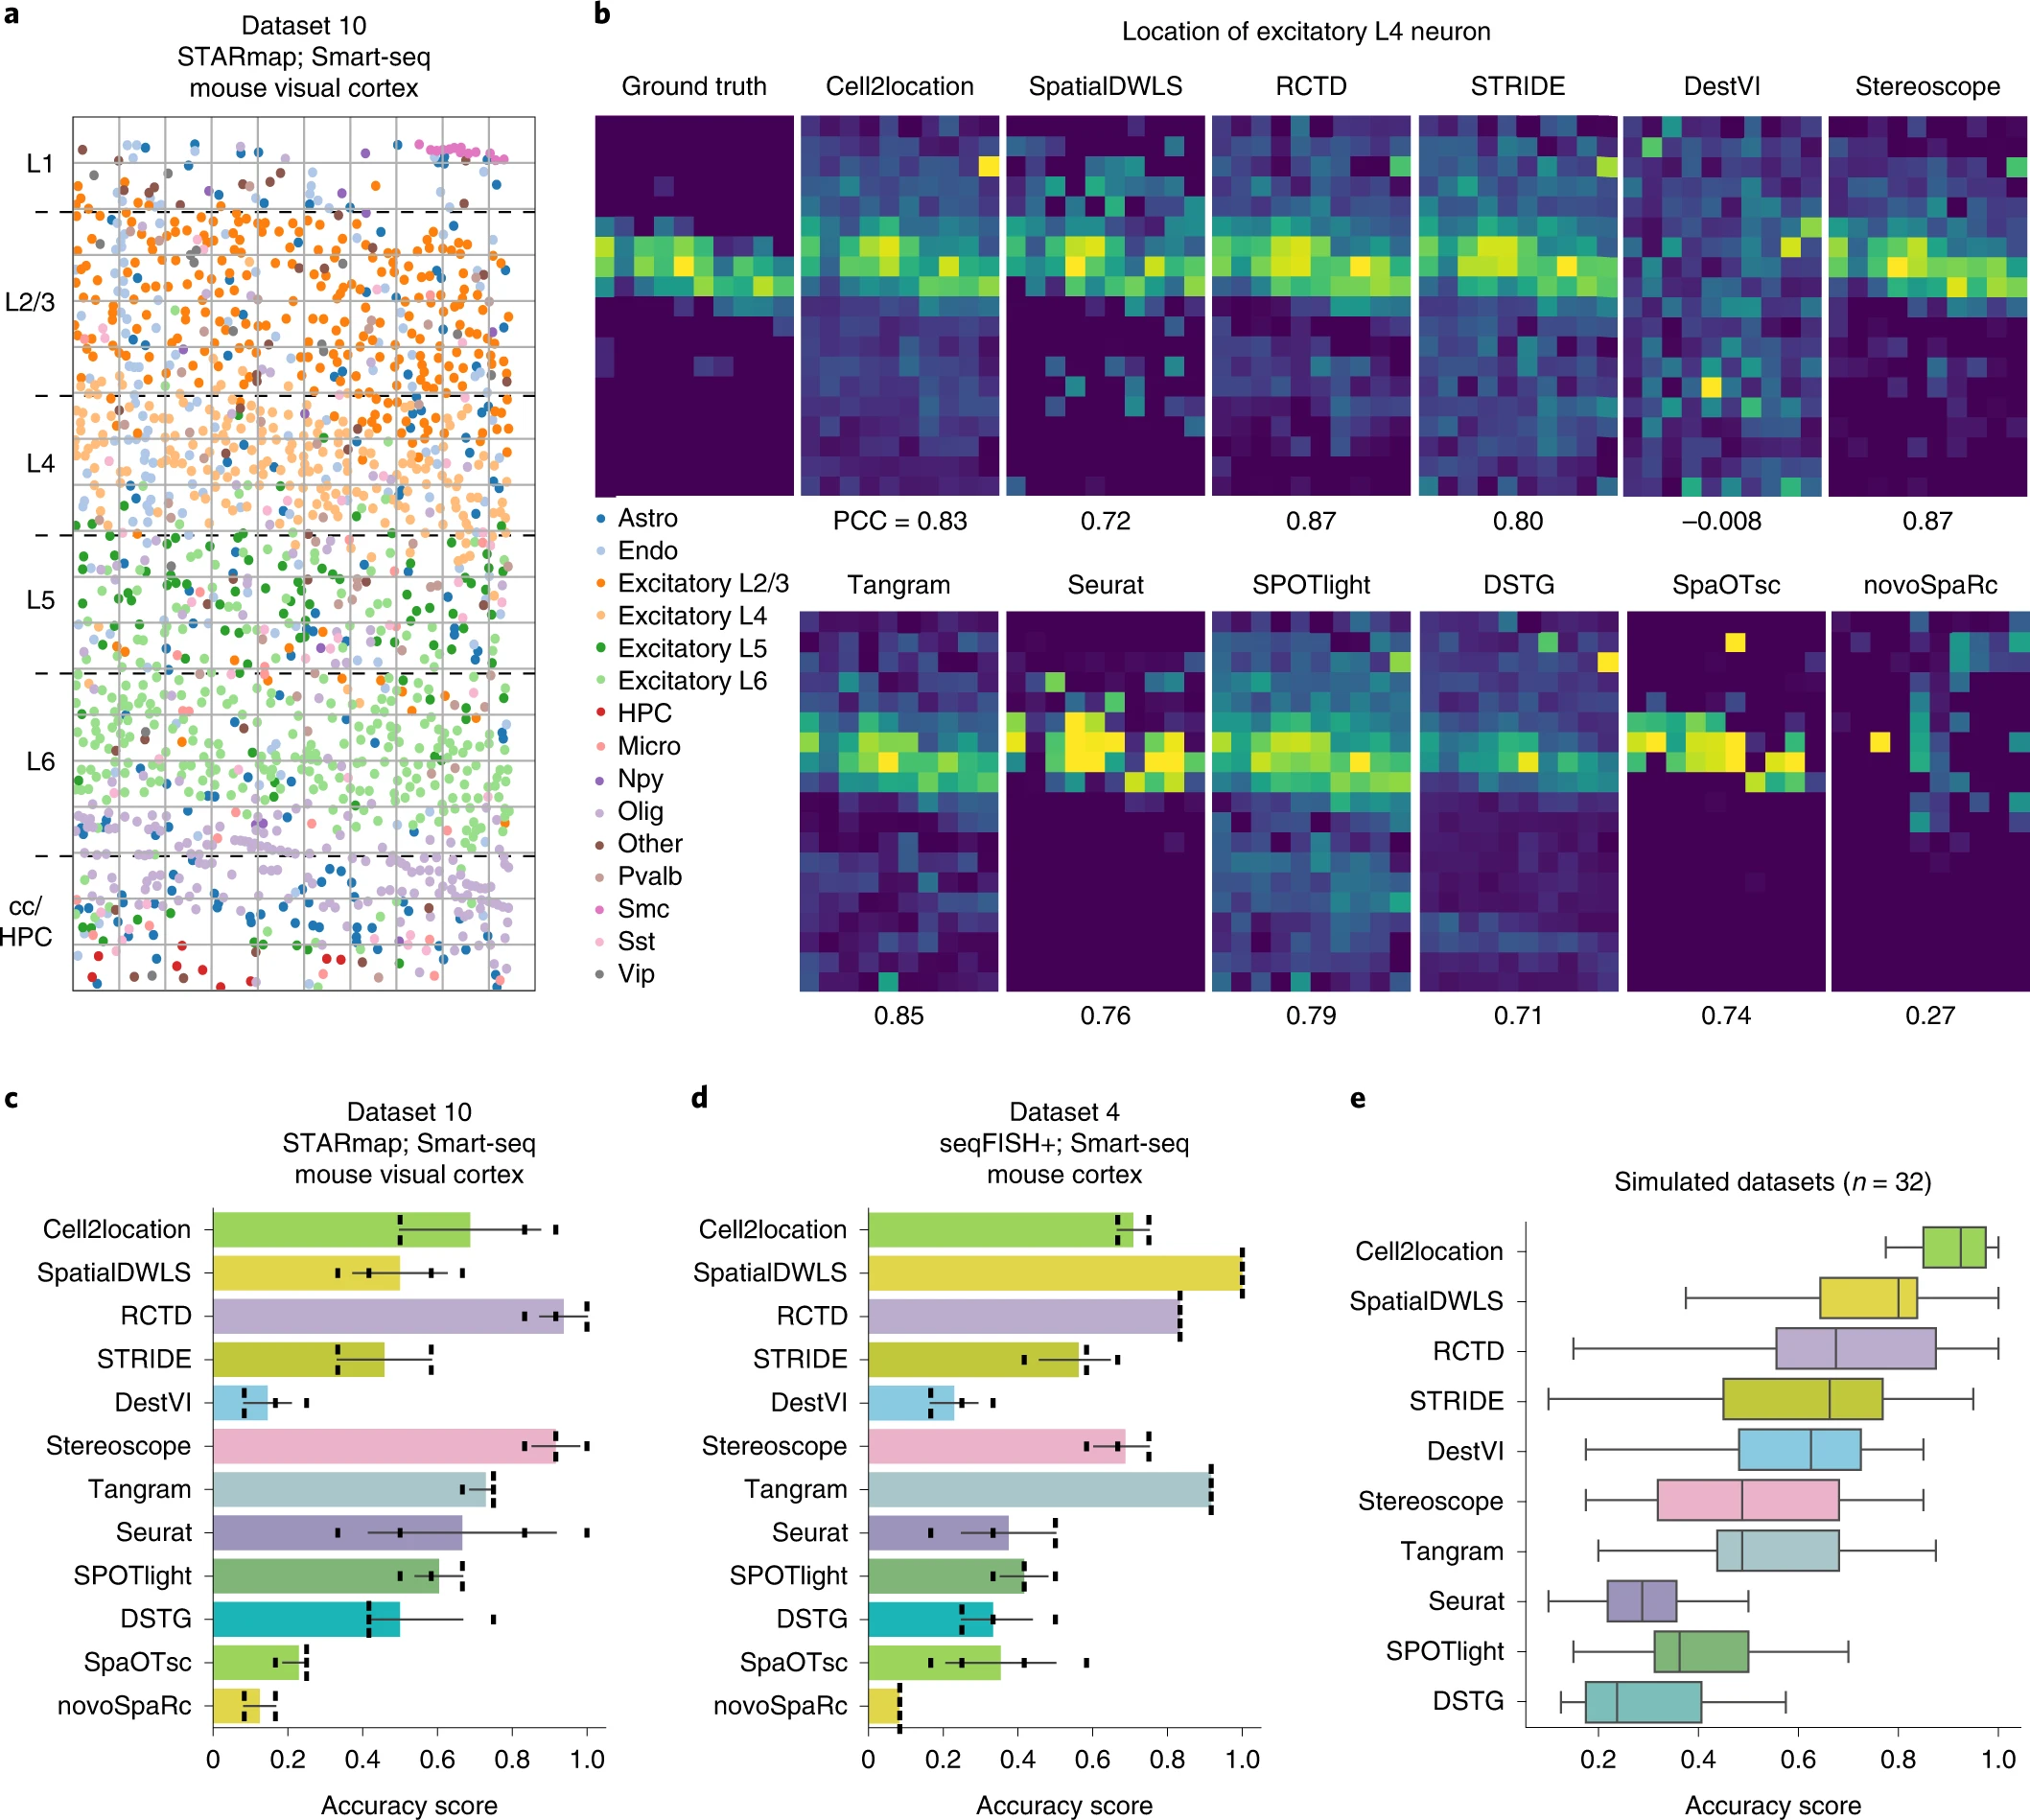
Figure 4. 比较能够对每个组织学点的细胞类型进行解卷积的 12 种整合方法的性能
(a) 数据集 10 的 STARmap 切片(STARmap; Smart-seq; mouse visual cortex),其中细胞按细胞类型注释。每个网格代表一个包含多个单元的模拟点。
(b) 8种整合方法以不同下采样率进行下采样在处理数据集 4 的稀疏表达矩阵时的RS值。
(c,d) 从数据集 10 ( c ) 和数据集 4 ( d )模拟的组织学spot的细胞类型组成的AS 条形图。
(e) 所有 32 个模拟数据集的 10 种集成方法的 AS 箱线图。SpaOTsc 和 novoSpaRc 被排除在外,因为它们需要每个点的空间位置信息,而这在模拟数据集中不可用。